
Good analysis requires good data infrastructure
By Dan Tonkovich

It is easy to get overwhelmed by data infrastructure - especially when all you want to do is a simple analysis or set up some basic reporting. Maybe just the term “data infrastructure” alone makes your eyes glaze over and elicits low-level anxiety. A cursory search on the web will not help. You will get results on databases, platforms, warehouses, lakes, portals, orchestrations, governance, and something called a “data mesh”. “I just want to know how much we spent last month!” you will yell at your computer screen. But here’s the good news: understanding just a little about data infrastructure can actually make your job reporting and doing analysis way easier. You don’t need to become an infra expert, just knowing the basics will help you get what you need faster, with less frustration. So let’s break it down, and I promise not to mention “data lakehouses” even once (starting now).
Let’s start with the good news: one picture can basically explain the whole thing.
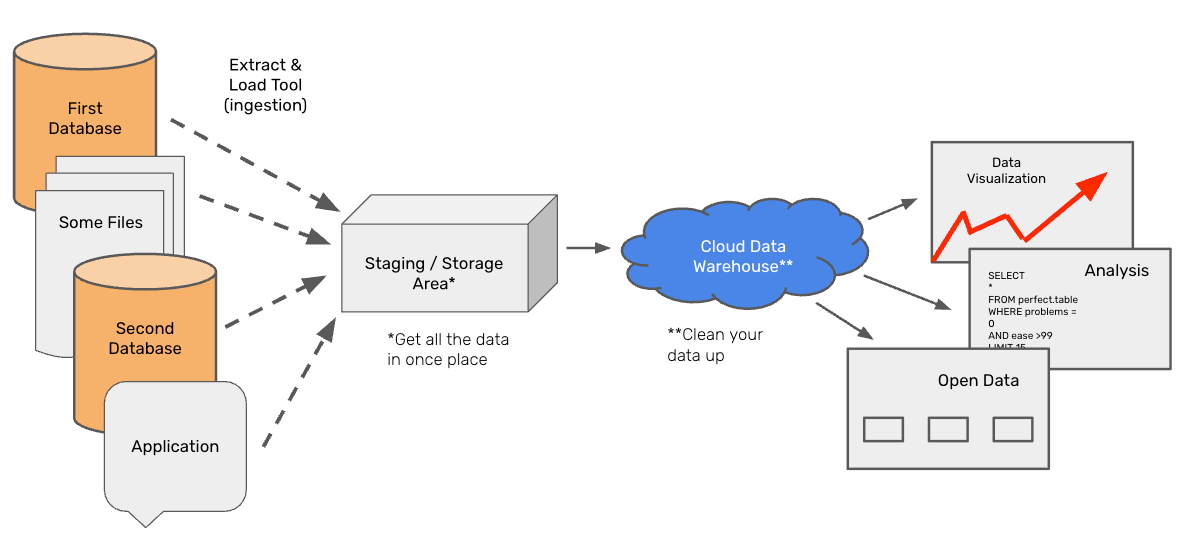
Bad News: this is an oversimplification. Below we will go over each discrete element in this picture, then outline where things can get more complicated.
Data Sources
You are probably familiar with a data source. Sources can be databases, applications, or files and are located on the far left side of the picture above. These are systems that collect data or are where data originates. Right now, you might have to ask someone to pull data from a source system whenever you need to run an analysis or your source system might be an excel spreadsheet.
There are many data sources within the City of San Francisco. I would know, I have to track them all! There are systems that store legislative files, public records requests, invoices, and street sweeping routes. Everything from ArcGIS to Siemens (apparently, we don’t have any systems that start with “Z”). In general, a source system should keep track of something or someone, though it may not be the best tool for analysis (more on that later).
Data Storage and Staging
In a single year, SFMTA collects at least 470 million data points on the locations of its transit vehicles. That’s almost 5 billion rows in ten years. You probably wouldn’t want to delete this data—it’s a valuable resource for analysis. But you’re also not using it every day. So, you need a place to store it where you can access it when needed while prioritizing cost efficiency over instant retrieval. This is what data storage is—a place to keep your data cheaply. Once you collect data in your source system, you should move a copy into your storage area.
There are added benefits to having a storage and staging area. First, you may need to use data from multiple source systems for an analysis. A centralized storage and staging area allows you to bring all the data into one place. Second—and probably an under-appreciated benefit—if you ever have to migrate to a new source system, the process becomes much easier. Instead of backfilling all your old data into the new system, you simply start copying your new system’s data into the same staging area.
Data Warehouse & Semantic Layer
So far, you’ve collected data in your source systems and moved it to your storage and staging area. But now you actually want to do something with it. That’s where your data warehouse and semantic layer come in.
Your data warehouse is the tool you use to process and refine your data. If your storage area is a piece of paper with numbers on it, your data warehouse is a (really good) calculator. It can join raw data sources together, clean up messy data, perform calculations, and ultimately provide well-structured datasets that allow you to answer your questions. Anything you find yourself doing repeatedly should be handled here—once and for all.
Need to clean up addresses? Do it in the data warehouse. Need to join a lookup table? In the data warehouse. Need to make all the text in the “notes” section lowercase because SOMEONE KEEPS FORGETTING TO TURN OFF CAPS LOCK? Also in the data warehouse.
Ultimately, your data warehouse should provide easy access to clean, reliable data and provide the computational power to support analysis and reporting.
Data Visualization, Reporting, and Repository
Now that your data is all cleaned up, you might want to create some “production” reporting. All this really means is that your boss wants to check the same dashboard every Monday to see how the program is performing… and you need to set it up. Since you now have clean datasets in your data warehouse, this should be easy. Just link your warehouse to your BI tool of choice, and start building those stacked bar charts!
As you create dashboards, you may find yourself repeating the same calculations over and over. When that happens, it’s a sign that those calculations should be moved upstream to the data warehouse—so they’re done once and available for every report. It may also be a sign that you need a data engineer.
You may also want to distribute your clean data to other people. That’s where data repositories—like our open data portal—come in. But no matter how many places you share your data, everything should always come from a single source: your data warehouse.
Moving your data
You may have noticed the arrows between each step in our process—because data needs to be moved from one place to the next. In my opinion, this is the hardest part to figure out. There are too many ways to move data, and none of them are perfect. Sometimes, you’ll use one tool to move data from your database to staging and a different tool to transfer data from your warehouse to your BI tool.
Many data warehouses offer prebuilt integrations with commonly used tools. Some teams prefer writing custom code (Python, SSIS), while others rely on out-of-the-box solutions like Fivetran, Azure Data Factory, Informatica, or AWS Glue. Whatever you choose, make sure it’s flexible (can read from- and write to all your sources), cloud-based (so your pipelines keep running even if you lose your computer), and has good monitoring capabilities (so you know if a pipeline fails).
Beware of the “do it all” software
Although I’ve outlined each step in this process as a separate tool, many software companies claim to handle everything in one package. They offer a built-in BI tool so you don’t need to buy your own, manage storage, and provide a warehouse solution. In some cases, this is a huge advantage—you only need to buy one tool instead of three! But in my experience, there are two major downsides.
First, I’ve never seen a company that does everything well. Most companies have one or two areas of real expertise, then bolt on additional services just to check the box. Make sure to test the full end-to-end functionality before committing to an all-in-one solution.
Second, the deeper you integrate with an enterprise software platform, the harder it is to leave. This is obviously great for the vendor but limits your flexibility down the road. Business needs change, and having the right mix of tools—not just what’s bundled together—will help you stay adaptable. Make sure any enterprise tool has a good API to pull data out if you decide another tool is necessary in the future. Remember: the data is yours, not theirs.
Infrastructure that works for you
Good data infrastructure makes analysis easier. While it can seem overwhelming at first—especially when confronted with an endless list of tools, platforms, and technical terminology—the fundamental goal remains the same: getting reliable, well-structured data into the hands of people who need it. By understanding the basic flow—from data sources to storage, from warehouses to reporting—you can work smarter, avoid redundant effort, and ensure your team isn’t stuck reinventing the wheel every time they need an answer.
Of course, no system is perfect, and there will always be trade-offs. Whether it’s deciding how to move data, choosing between specialized tools or all-in-one platforms, or dealing with the occasional all-caps data entry disaster, flexibility and long-term thinking are key. The best data infrastructure is one that works for you—not the other way around.